System Requirements
RelaxIS 3 can be installed on any computer running Microsoft Windows 10 or 11 with .NET Framework 4.7.2.
The .NET Framework is pre-installed on most systems, or directly available from Microsoft.
Feature List
- Robust customizable fitting algorithms
- Autofit-function for quickly fitting arbitrary models without parameter initialization
- Parameter-initialization from shapes (i.e. semicircles) drawn into a spectrum
- Monte-Carlo based estimation of fit parameter uncertainties
- Parameter influence tester, that shows the impact of each parameter on the fit
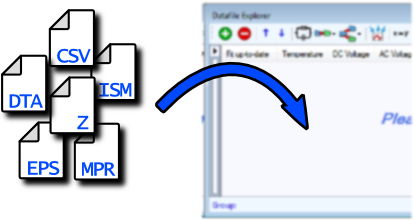
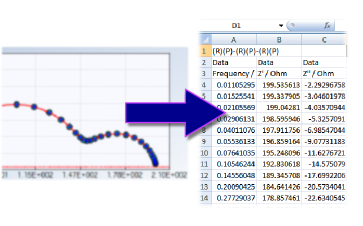
- Import of arbitrary, column-based text files using an easy-to-use wizard
- Native support of numerous impedance data formats
- hcDLL (rhd instruments GmbH & Co. KG)
- Nova RelaxIS Export Format
- Nova .NOX (Metrohm(c))
- .EPS (Novocontrol WinDETA(c))
- Novocontrol WinDETA(c) ASCII export file
- .ISM (Zahner Zennium(c))
- .MPR (BioLogic EC-Lab(c))
- .Z (Scribner ZView(c))
- .DTA (Gamry instruments(c))
- Digatron .CSV Export
- .IDF, .IDS (Iviumstat)
- .SPEC (Sciospec)
- Solartron Modulab ZView Export
- .PSESSION (PalmSens BV PSTRACE)
- Arbitrary number of spectra per project
- Storage of metadata for each spectrum
- Temperature
- DC voltage
- AC voltage
- Current
- Time
- Harmonic
- Concentration
- Area
- Thickness
- SOC
- SOH
- Two Free Parameters
- Editing of the raw impedance data
- Ability to use dielectric spectra, given in e.g. permittivity and with unknown cell geometry
- Within one project, spectra can be assigned to various, arbitrary equivalent circuits
- Circuit-Screening tool, that helps in finding suitable equivalent circuits
- Visualization of the data and fit results in impedance, admittance or capacitance domains in Nyquist or Bode plots (customizable)
- Ability to show multiple different plots (i.e. Nyquist and Bode) at the same time.
- Live-analysis views, that automatically show i.e. DRT or Kramers-Kronig tests while browsing spectra
- Side-to-side comparison (overlay) of multiple spectra
- Template-based graph style customization
- 3D-Plot overlay of multiple spectra
- Extensive library of pre-defined equivalent circuits
- Simple derivation of initial values using the intuitive circle- or line-tool, or a genetic algorithm
- Live preview of changes in the fit parameters
- Test Fit function to preview the fit results
- Batch fitting of several, related spectra
- Fit wizard for automated evaluation of particular types of spectra (e.g. conductivity measurements)
- Multi-spectrum fits, i.e. "global parameters" or with parameters estimated from metadata-based models.
- Result Preview and Evaluation feature that allows the plotting and evaluation of the fit parameters as a function of metadata
- This implements Arrhenius- and VFT-Fits
- Includes various other models
- Built-in Mott-Schottky analysis of a series of spectra
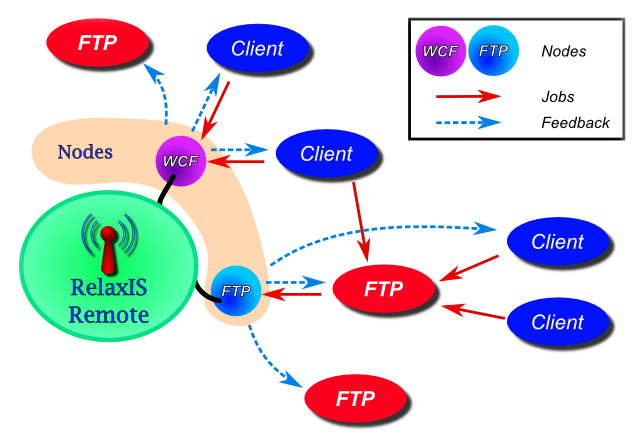
- RelaxIS Remote feature for autonomous evaluation and storage of impedance data
- RelaxIS SDK that allows the enhancement of the basic features with plugins
- Plugins are for example new file formats or circuit elements (and much more)
- Integrated Code Editor to help with the developement of plugins
- RelaxIS WCF Link feature for calling RelaxIS functions (i.e. fitting) from external software on the same PC
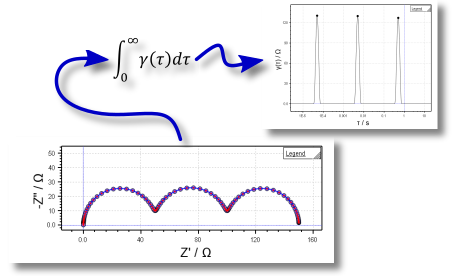
- DRT (Distribution of Relaxation Times) Analysis
- Linear Kramers-Kronig Test
- Z-Hit calculation
- Residual analysis and visualization
- Circuit simulator for application in research and teaching
- Define multiple models with separate, customizable parameter values
- Freely change the simulated frequency range and number of datapoints
- Customizable overlay plot of all simulated models
- Ability to add normal-distributed noise to the data
- Export-to-RelaxIS function to send simulated spectra to RelaxIS as data
- Extensive export functions for every data type
- Fit results
- Impedance spectra with fits
- Simulated spectra
- Graphs as images
- Images of Equivalent Circuits
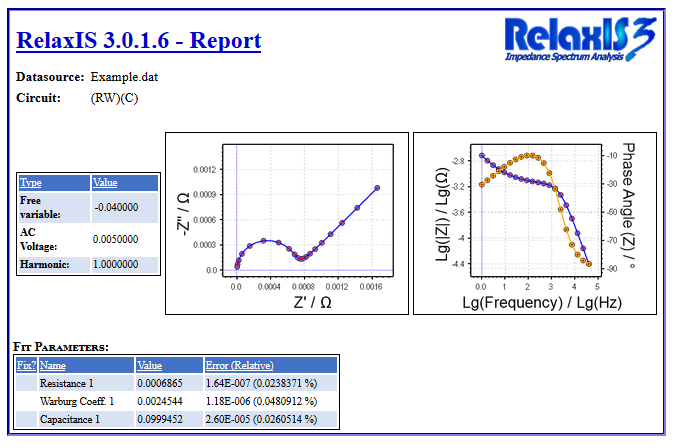
- Reporting feature that allows the creation of rich, HTML-based summarys of fit results
The software RelaxIS - Impedance Spectrum Analysis has for instance been used for the following applications:
- Temperature-dependent conductivity measurements
- Investigation of battery components
- Investigation of the differential double layer capacity in systems with ionic liquids
- Impedance spectroscopy of dye solar cells
A great advantage is the ability to read data formats of varying measuring devices as well as the elegant and fast evaluation of numerous series of measurements with many spectra.
Version 3.0.22
Version 3.0.22.29
- Fixed a bug that caused the main graph to reset the zoom level, ignoring the setup option
Version 3.0.22.28
- Fixed bug that caused the Spectra Exporter to not show the list of contents in the Export Center
Version 3.0.22.27
- Fixed visual bug for analysis circles in graphs
Version 3.0.22.26
- Fixed a program crash that occured when trying to export too many DRTs at the same time
- Added separate "Export all" and "Export selected" buttons to the DRT export menu
- Added functions to save and load DRT job lists (via right-click context menu on the job list)
Version 3.0.22.25
- Fixed a bug that could prevent users from loading .EIS3 files from network locations
- Analysis (semi-)circles are now included in image exports to .SVG files
Version 3.0.22.24
- See a feature overview at: https://www.rhd-instruments.de/products/software/relaxis/relaxis-3-0-22-features
- New DRT user interface
- The DRT Dialog has been reworked
- Allows for calculation of multiple jobs and spectra
- Streamlined result analysis
- Added new DRT analysis tool: Peak Fitting
- DRT results can be plotted in a 3D-plot
- DRT View also now contains similar features
- New Result Preview user interface
- Settings have been moved to separate (dockable) dialog
- Sorted settings into separate tabs
- Added option to plot result series into a 3D-plot
- Plot now applies automatic axis titles
- Added X-axis and Split settings for better default behavior
- Reworked the saved formulas into full Presets for formulas and plots
- New Graph Style Template system
- Replaces old templates (includes conversion of old templates)
- The templates now contain multiple plot templates
- Each plot in RelaxIS uses an assigned plot template
- Added new user interface for editing the templates
- Added missing tags for importing .MPR files
- Fixed a bug that could reduce performance of the Nelder-Mead fit
- Unknown File Dialog: Improved delimiter detection and added quotation-escape handling
- Added setting for selecting if duplicate frequencies split data into multiple spectra on import
- Import Metadata from Filename RegEx is now correctly applied for unknown data files
- Autofit now handles custom limits differently
- Autofit usually selects tight parameters limits automatically
- Previously, changing only minimum or maximum to custom value would still apply the automatic limit for the other
- Now, if any limit is changed, no automatic limit for the other is applied
- This fixes cases, where the automatic limit was incompatible with the custom limit
- Added several example datasets
- Added "Pressure" metadata field
Version 3.0.21
Version 3.0.21.17
- Fixed bug that prevented metadata from being changed directly in the Spectra Explorer table
Version 3.0.21.16
- Improved speed of fit algorithms for all fit types
- Significantly lower number of function evaluations benefits slower models
- Increased reliability of Autofit
- Autofit, Multi-Spectrum Fit, Global Fit can now be cancelled
- Added new DRT export for spectra, basis functions and reproductions (via last page of DRT dialog)
- Added point limit to DRT overlay and generally improved performance
- Added global graph layout settings (accessible via Setup dialog)
- Allow setting of overall graph layout like zooming mode or legend placement
- Applies to all graphs in RelaxIS and Circuit Simulator
- Added compatibility to EC-Lab 1.50+ file format
- Added a function to split unknown files by values in a designated column
- Fixed a calculation error in Tlmx (generalized TLM) element
- Only affects 3 specific configurations (x=any type, norm = any non-short or open circuit)
- Namely: Tlmx[inf,0,x,0,norm], Tlmx[inf,norm,x,norm,norm], Tlmx[0,x,x,norm,inf]
- Calculated impedance and hence parameters were invalid in these cases
- Fixed problem that could cause Combined Data Plot to not properly update when paused
- Fixed a bug in the automatic splitting of impedance spectra during import
- Fixed a bug that caused the fitters to use 4-point dif. instead of 2-point dif.
- Fixed a crash in the Hotkey setup
- Fixed various DPI scaling issues
- Changed default mouse-wheel zoom-mode to one that keeps the chart position stable.
- More intuitive mode for new users of RelaxIS.
- Use global graph settings to restore legacy behavior.
Version 3.0.20
Version 3.0.20.19
- Unknown File Dialog: Fixed line misplacement between columns, when files contained incomplete lines in the data section
- Fixed possible exception in the DRT View
Version 3.0.20.18
- Fixed a bug preventing cancellation of batch/multi-auto fits
- Fixed a bug that caused the TLM Wizard window to show multiple times on subsequent openings
- Fixed wrong result names for Resistances in the Electrochemical Calculator
Version 3.0.20.16
- Fixed loading of non UTF-8 files via the new unknown file import dialog
- Fixed import when metadata columns had missing or invalid values
- Fixed bug that could cause certain file formats from interfering with file import
- Added automatic determination of number format
Version 3.0.20.14
- Added missing sorting and filtering functions in the new unknown file import dialog
- Added automatic saving of last format to unknown file import dialog
- Fixed a bug that caused some unknown file format settings to not be loaded correctly
- Added support for silent installations using the /S argument on the RelaxIS installer
Version 3.0.20.13
- New import dialog for unknown data files
- Wizard-style interface for better clarity
- Added import functions: Header lines, exclusion of individual lines
- Method to import from sets of columns by specifying a repeating column count
- Automatic determination of column roles from header texts
- Ability to save import settings under names for future use (also available in interface functions afterwards)
- New control scheme: Always use selected spectra
- Available for many RelaxIS functions like fitting or model assignment
- Functions are applied to currently selected spectra, instead of using the spectrum selection dialog
- Mode disabled by default. Enable in Main ⮕ Settings ⮕ General ⮕ "Always use selected spectra..."
- Fixed bug that prevented the Change Metadata dialog from working correctly
- Fixed formula function parsing in i.e. the Result Preview dialog
- Fixed Circuit Simulator Export file import to RelaxIS
- Improved metadata import from DTA files
- Fixed possible crash in DRT spectrum reproduction function
- Changed menu layout in Circuit Simulator
Version 3.0.19
Version 3.0.19.18
- Fixed embedded resource problem that prevented i.e. the styled text editor for graph elements from working.
Version 3.0.19.17
- Fixed problem with CSV files not being correctly imported via the unknown file dialog.
Support for Windows 7 has ended. It is recommended updating to Windows 10.
- Spread Parameters can now selectively handle lower and upper limits
- Added RelaxISWCF function to parse data (files) into spectra via the built-in file formats
- CompreDriveRemote job evalutions can now use an Autofit for fitting
- Included model and frequency limits in Spectra Export
- MPT file format now imports RE/CE and WE/CE spectra if available
- Increased number of rows shown in the Unknown File Dialog to 500
- Introduced data value limit for file imports to avoid problems with invalid data points (e.g. a frequency value >10^50)
- Fixed a possible freeze on multi-monitor setups with different DPI scaling
- Fixed a possible deadlock (freeze) related to the spectrum list
- Fixed wrong parsing of filenames from Outlook attachments
- Fixed a possible crash on Autofit initialization
- Includes update to Codemeter Runtime (v7.40) - Requires Windows 10!
Version 3.0.18
- New Feature: Create shapes from a selection of points
- An alternative to the manual creation of semi-circles and lines for parameter derivation
- After activation, drag a box around datapoints. RelaxIS will automatically create a semi-circle shape that fits these points
- Hold Shift while dragging the box to create a line that fits the points
- New Feature: Regular-expression based extraction of metadata from filenames during file import
- Uses a regular expression defined in the setup dialog to extract values for metadata fields
- The values are taken and assigned via named capturing groups
- The setup dialog contains a designer that lets you test the regex against a filenames
- Stacked plots now support automatic cycling through line and marker styles, when activated in a graph style
- Create Circle/Line tools is now automatically switched off if an unsupported plot layout is selected
- Fixed a bug that in some circumstances could cause spectra to not be saved correctly in EIS3 files
- Fixed a bug that could cause RelaxIS to freeze
- Fixed a crash if the recent file list contained empty entries
- Fixed a crash when screenshots of the 3D Graph were saved multiple consecutive times
- The normal installer should now be compatible with Windows 7 again
- Note: Windows 7 support will be dropped as of 01.01.2022!
- We recommend updating to Windows 10 before that.
Version 3.0.17
For Windows 7 users, don't update via the integrated updater. Instead, download the dedicated Windows 7 installer from https://www.rhd-instruments.de/relaxis-downloads/
Note that Windows 7 support for RelaxIS ends on December 31st, 2021.
- Fixed a bug that caused the Circuit Simulator to use the logarithmic setting of the Y2 axis for the Y1 axis.
- Fixed a bug that prevented the legend text override when exporting the Result Preview graph as an image from being applied, if Auto-Update was active.
- Reworked the model library and its integration in RelaxIS functions
- Built-in models are now based on models used in literature and sorted into respective groups
- Most built-in models have associated literature references
- Model library has a new model list, that allows for a better overview over models and direct access to the references
- When adding used-defined models, any group name can now be chosen, replacing the fixed User-defined and Favorite groups
- Same model library is used in Model Screening, and model information are shown in results
- Existing user-defined models will be moved to the new library automatically
- Fixed a bug that caused the result parameters to not be shown in Model Screening results
- Added description of spectrum type to datasource field of spectra read from Biologic MPR files
- Resizing of the RelaxIS and CS3 main windows is now more responsive
- Fixed possible crash in the "Move Spectra to between Projects" function
Version 3.0.16
Important for Windows 7 Users: An error may cause RelaxIS to not start correctly on Windows 7 installations. We recommend using v.3.0.15 until this is resolved in a maintenance update.
- Circuit Simulator Improvements
- New series spectrum generation methods, that allows varying of multiple parameters
- Changed noise generation method to now generate magnitude and phase noise separately
- Noise generation now uses a fixed seed unless shuffled, to make generated noise consistent between updates
- Added AIC statistic (for proportional weighting) to Info View
- RelaxIS and CS3 main menus (ribbons) can now be minimized by double-clicking the tab-headers. Double-click again to disable minimization again.
- Added method to perform Kramers-Kronig test on admittance data
- Added the ability to assign additional metadata when importing unknown text files
- Added Novocontrol DCD file format
- Improved reading of Nova NOX files if Metrohm Nova is installed on the same PC
- Fixed reading of Ivium files with galvanostatic spectra
- Added option to disable automatic zoom-out of the Data Explorer plot
- Fixed bug that prevented Circuit Simulator from closing the Trial Client
- Improved RelaxIS startup speed
- The L parameter on transmission-line models is now Fixed per default
- Fixed possible deadlock when using WCF fit functions from RelaxIS plugins.
- Added DRT Tutorial to Help⮕Tutorials
Version 3.0.15
- Maintanance Update 3.0.15.18
- Fixed a crash during Autofits for certain parameter limits
- Fixed graphs crashing when Engineering tick labels where active for certain value ranges
- Fixed a crash when multiple instances of RelaxIS were started at the same time
- Fixed a bug preventing formulas to be entered into certain tables
- Improved metadata parsing for ISM files
- Added Standard Error of the Estimate (SEOE) to the Info View
- Added switch between absolute and relative significances to the Significance Tester
- Maintanance Update 3.0.15.14
- Fixed a bug that prevented pasting into some tables
- Fixed FIPS compliance on some Windows systems
- Fixed sending and exporting of selected spectra in CS3.
- Added new fit option "Automatic local minimum improvement"
- Tries to improve a fit result after it ended up in a local minimum
- Uses additional fits with with "bumped" parameter values
- May be disabled in Settings ⮕ Fitting
- Added option to plot either tau, frequency or angular frequency in DRT plots
- Added option to spread parameter names to other spectra
- Added XLog, Y1Log and Y2Log options to report plot tags to enable or disable logarithmic axes scaling
- Added new fields to Biologic MPR file format.
- Improved copy & paste and keyboard behavior in Spectra Explorer table
- Fixed possible crash when no active data was present in a spectrum.
- Fixed a problem that could cause ribbon menus to become unresponsive in multi-monitor high-dpi setups
- Fixed a crash related to clicking a cell for confirming a value edit in the Spectra Explorer
Version 3.0.14
- New Plugin Validation feature
- NOTE: If you have plugins installed, you will see the validation screen on first program start
- All new or changed plugins must now be explicitely activated before they are loaded by RelaxIS
- On program start, a dialog is shown that allows you to mark the plugin files that should be loaded
- Plugin files that don't have a checkmark will NOT be loaded
- The selection can be changed from the Settings dialog (Plugins)
- New DRT functions
- DRT Overlays: Create overlays of DRTs of multiple spectra
- Spectrum reproduction: Recalculate a spectrum from a DRT result for result validation
- Lambda-Plot: Check the reproduction quality of different lambda values
- DRT settings are now saved
- New Model Styler feature
- Create model images with additional styling, like colors and element descriptions
- Further allows customization of cable thickness and color
- The Mott-Schottky tool can now use results from Zarc elements
- In the Merge Spectra function, identical frequency values may now be summed as well as averaged
- Added some more buttons to the quick-access toolbar in the top-left
- Data Manipulation plugins can now add spectra by overriding the "NewSpectra" property
- The WCF-Interface now offers additional functions to calculate DRTs and spectrum reproductions
- Fixed some program crashes and bugs
Version 3.0.13
- New Analysis Views: Kramers-Kronig, DRT ZHIT
- Live updating analysis views can be displayed via Plotting ⮕ Create new Spectrum View
- The views display the respective analysis result for the currently active spectrum
- The analysis methods can be configured via dedicated settings dialogs
- Added frequency range adjustment buttons to the Kramers-Kronig dialog
- Improved graph image export with additional options
- The size setting can now define the inner chart rectangle to e.g. export rectangular graphs more easily
- It is now possible to set a fixed scaling factor for more reproducible image layout
- Settings in the image export dialog can now be saved and restored
- Graph axis tick labels can now have various different formats
- Exponential: 1.234E5
- Scientific: 1.234x10^5
- Engineering: 123k
- Added more settings to RelaxIS Graph Styles
- Axis tick label number format
- Graph scaling factor
- Keep legend always open
- The RelaxIS WCF Link feature now provides an interface for Auto Fits
- Added option to disable hiding of parameter errors for fixed parameters
- Improved reading of temperatures from Zahner ISM files
- Fixed discrepancies in how parameters are named per default in different RelaxIS functions
- Stored evaluations are now properly cleared when a new project is created
- Fixed possible crash in Mott-Schottky dialog
- Fixed crash in the Update Dialog when the downloaded installer could not be executed
Version 3.0.12
- Fixed program crash when duplicate frequencies were present for ZHIT or DRT
- Fixed bug that prevented the Tlmx (user-defined TLM) from being entered as a model
- Fixed bug that prevented "Thickness" from being selected as X-Axis in Result Preview
- Circuit Subtraction now supports formulas for parameter values
- Formulas can reference existing values and metadata
- Improves applying the subtraction to multiple spectra in the same operation
- Available formula symbols can be viewed from the Info button on the dialog
- Added hotkey for showing/hiding graph legends
- Ctrl+L shows and hides the legend of the active graph
- Activate a graph by clicking on it
- Added new "Help" tab to the main menu that combines access to the manual and tutorials
- Improved parsing of Biologic MPR files
- Should provide better support for different used techniques
- Spectra are split primarily by cycle number
- The Info View now shows number of datapoints even if no model is assigned to the spectrum
- Fixed possible crash when entering invalid model strings
- Fixed resource overflow on continuous use of the Combined Data Plot
- Fixed possible crash in the Batch Fit feature
- Fixed incorrect placement of data annotations on high aspect-ratio data
Version 3.0.11
- New feature: ZHIT algorithm for data correction
- Calculate the ZHIT transformation with variable smoothing and interpolation
- Calculates |Z| from the phase angle
- Intended for correcting e.g. slow drifts in spectra
- Mott-Schottky dialog can now calculate C from CPEs/resistors
- Added automatic generation of Brug-formula to Result Preview formula dropdown
- Spectra can now be copy/pasted in the clipboard
- Access feature by right-click in the Spectra Explorer
- Spectra can be pasted into other running instances of RelaxIS
- After copying you can change the active project in the current project folder and paste the spectra there
- In the "Spectra Export" of the Export Center, you can now export spectra into multiple individual files
- It is now possible to adjust the default parameter values and limits for built-in model elements
- The feature is accessible through Main⮕Settings⮕Default Parameters
- You can add model elements and set its default values
- Added further drawing objects to all graphs
- Right-click any graph, select Drawing Objects
- Select Line, Rectangle/Ellipse or Text boxes and drag to create
- Right-click on any blue mouse handle of an object to access styling options for this object
- The Kramers-Kronig feature now allows creating new spectra from the simulation result
- Improved some rendering issues in graphs
- After an Autofit, the "Reorder elements by time constant" plugin is now automatically called for the spectrum
- Intended to improve clarity of results when comparing multiple spectra
- Feature can be disabled from the Setup dialog (Fitting tab)
- On startup, error checking is performed on plugins to avoid program crashes
- Fixed DPI scaling issues in the Kramers-Kronig dialog
- Fixed scaling issues in the Model Builder that could lead to unusable Favorite/User-defined tabs
- Fixed possible crashes with invalid values in numeric display bars
- Fixed crash when a Multi-Autofit is canceled
Version 3.0.10
- CRITICAL: Please update 3.0.10.20 installations to 3.0.10.21 to fix a mathematical error in the Gerischer element that caused discrepancies between 3.0.10 and previous RelaxIS versions
- New feature: Transmission-Line-Library
- Offers an overview over available TLMs together with scientific explanation
- Model Builder ⮕ TLM Wizard
- New Generalized-TLM, that allows you to build a custom TLM easily from sub-circuits
- New pre-defined TLM elements (see manual, or library description)
- Tlmqo, Tlmqs, Tlmeb, Tlmenb
- These will block use of plugins with same name!
This may break projects with models using circuit element plugins with the same abbreviation. Please contact This email address is being protected from spambots. You need JavaScript enabled to view it. if you have this problem!
- New feature: Graph Styling
- The style of impedance spectra plots in RelaxIS is now fully customizable
- Main Menu ⮕ Plotting ⮕ Edit Graph Style
- Separate colors for the different series can be defined, as well as fonts and line styles
- Styles are handled in a style library, that allow you to create and share styles
- Improved coloring of fit parameter errors
- The percentage when the color gradient reaches deep red is now configurable in the Settings
- Fixed parameters now don't display an error value
- Parameter values of zero now display a gray background since no relative error can be calculated
- Multi-Auto Fits now work on multiple spectra (Settings⮕Fitting⮕Multithreading Lists Lists) simultaneously to improve speed
- Added warning popups when fit stopping critera were hit. These can be disabled in the Settings dialog.
- Added "Tan(delta) dielectric" axis value, to conform to IEC 60050
- Changed calculation of "Tan(delta)" from tan(d) = Z'/-Z'' to tan(d) = Z'/|Z''|
- Added PalmSense pSession file format
- Added support for new versions of the Biologic MPR format
- When exporting graphs as image, invididual series can now be excluded from the legend
- Graph axis labels can now be divided by a constant factor through the Graph Layout Options (right-click a graph)
- Fixed a bug that prevented loading of EIS3 files from network shares
- Fixed a bug that could cause duplicate datapoints to be read from Nova RelaxIS Export files
- Fixed a problem that could cause a crash when using the Frequency Change feature
- Fixed problem that could cause the controls in the Kramers-Kronig dialog to be
- Fixed the problem, that the RelaxIS deinstaller did not remove its entry in the list of installed applications
- Updated included Codemeter Runtime to version 6.70
Version 3.0.9
- New feature: 3D Plots
- Create customizable 3D plots, with free rotation
- Allows assignment of both impedance and metadata to each axis
- Surface plots can be created in an external browser window
- New feature: SVG export for graphs
- All (2D) graph can now be exported as SVG vector graphics
- The SVG files can be edited using third-party tools or displayed in a browser
- Allows freely scalable graphics
- New feature: Mott-Schottky Analysis
- Automated workflow to find donor density and flatband potential from dc voltage dependent spectra
- Allows analysis of multiple datasets at the same time
- Biologic MPR file import now handle multiple cycles and measured CE impedance better
- Novocontrol .EPS file import now handles newer versions correctly
- 2D Graphs may now have a title that can be set using the Graph Layout options
- The Trial Client can now be started only in a single instance and communicates better with RelaxIS
- Fixed a problem of the License Manager with newer Codemeter dongles
- Various bug fixes
Version 3.0.8
- New Feature: Circle Visualizer
- Access from Plotting⮕Create Spectrum View⮕Circle View
- Creates a visualization of semi-circles for e.g. R-(R)(C)-(R)(C)-P type models
- New Feature: DRT Polarization Remover
- Subtracts a low-frequency polarization from data before calculating the DRT
- Avoids high-time-constant peaks due to infinite rise in the low-frequency domain
- Added styling options to the Circuit Simulator
- The duration that datapoints are shown on click in charts can now be adjusted from right-click⮕Graph Layout Options
- Datapoint annotations can now be closed by clicking
- Fixed wrongly auto-generated code in the SDK Code Editor
- Fixed problem with a wrong settings page being shown in the Change Metadata dialog
- Fixed possible crashes
- Includes new Codemeter Version 6.60
- Fixed some scaling issues of the GUI
Version 3.0.7
- Improved Combined Data Plot
- The Combined Data Plot was redesigned to offer more options and customizations
- It can now include both data and fit curves
- It can operate in a "live" mode that always displays the currently selected spectra (default)
- More graph layout options were added (e.g. symbol size, line width)
- Extended formatting of the automatic legend (please see manual)
- Multiple CDP windows can be open simultaneously
- Added quick-info status bar to the Parameter Explorer
- Calculates values for certain elements or element-combinations
- If resistor is selected, the conductivity is calculated (specific conductivity if Area and Thickness are defined)
- For a combination of R and C or CPE both the time-constant and equivalent capacitance (from Brug-formula) is calculated
- Values can be copied to clipboard through right-click context-menu
- Added option to always display certain metadata fields, even if columns are hidden and column is empty (Settings⮕Display)
- If an unexpected exception occurs it is now possible to continue the execution of RelaxIS
- You are given the option to either shutdown RelaxIS immediately or continue
- Continuing happens at own risk, because RelaxIS is in an undefined state and may not function properly
- Continuing is only intended to offer possibilities to save the current work in a controlled manner and then restart RelaxIS
- Consider saving into new EIS3 files instead of existing ones, in case data is corrupted due to the undefined state!
- It is now possible to directly import eps'/eps'' and Mod'/Mod'' data from unknown data files (spectra are marked as eps-only)
- Fixed crash in Model Screening while a test fit was displayed in Data Explorer
- Fixed crash a when the Move Spectra buttons were used while the spectra list was empty
Version 3.0.6
* SDK Breaking Changes *
- Some plugins will not be loaded anymore until certain changes to the code are introduced
- Affected plugin types: CircuitElement, TransferFunction, AxisValue, MultifitModel
- Plugin functions are required to now return a "Complex" structure instead of a Tuple
- Please refer to the SDK Documentation for detailed implementation help for the changes
* Release Notes *
- Improved the Kramers-Kronig-Test
- The KK-test by default now employs a complex fit included a series capacitor and inductor as of J. Electrochem. Soc. 1995, 142, 1885-1894
- Helps to handle spectra with e.g. polarisation or diffusion effects better
- Added automatic determination of optimal number of time constants as of Electrochim. Acta 2014, 131, 20-27
- Updated the spectrum layout to the default RelaxIS style
- The Shapiro-Wilk-Test results can now be accessed in copyable form
- Numeric input boxes and tables (Gridviews) now support input of numbers with magnitude modifiers
- E.g. 1M ⮕ 1E6, 12n ⮕ 1.2E-8
- Also possible: 1.52E-5M ⮕ 15.2 (=1.52 * 10^-5 * 10^6=1.52E1)
- Modifiers from 1E-24 ⮕ 1E24: y, z, a, f, p, n, u or µ, m, %, k, M, G, T, P, X, Z, Y
- Note: Exa (10^18) is X, not E to avoid confusion with exponential notation
- Implemented a new file format for Metrohm Nova ⮕ RelaxIS export files
- Custom export format implemented in upcoming version of Nova
- Supports export of both impedance data and metadata
- Implemented Solartron Modulab ⮕ ZView file format (wasn't compatible with default ZView format)
- Improved automatic splitting of Biologic .MPR files
- Added duplicate filtering when importing Nova NOX files
- Program-wide change of the name "Group" to "Model" to reduce confusion (no change in functionality)
- Circuit Images can now be copied to the clipboard with transparent background
- Fixed problem that caused RelaxIS to further lock up when encountering an unhandled error
Version 3.0.5
- New Feature: Result Library
- Ability to store results of various features on project level
- Results can be displayed (read-only) at a later time
- Designed to be independent of any plugins
- Certain results or settings can be reused to perform new evaluations (e.g. set current Result Preview settings from stored Result Preview)
- Supported evaluations:
- Result Preview
- Result Evaluations
- Residual Analysis
- Multi-Spectrum Fits
- Kramers-Kronig-Test
- DRT
- Individual Fits
- Combined Data Plots
- Circuit Screening
- Parameter Influence Test
- Bootstrap Error Estimation
- Results can be exported to and imported from sharable XML files
Note: To store the results, the EIS3 database format was updated. Old EIS3 files will be updated automatically to the new format. This creates MigrationBackup files for safety at their old locations.
- New Feature: Fits with shared parameters (Global Fit)
- Fitting of multiple spectra simultaneously
- One or several parameters can be shared, and thus apply to all spectra equally
- Application: Situations where you expect certain parameters to not change during e.g. a measurement series
- Globally fitted parameters are marked as "Global" in the Parameter Explorer
- Main Menu⮕Fitting⮕Global Fit
- New Feature: Multi-Spectrum Fit
- Similar, yet more advanced than the Global Fit
- Multiple spectra are fitted with a new model that can incorporate spectra's metadata as independent variables
- Application (e.g.):
- Creating models with shared parameters and different equivalent circuits for certain spectra
- Calculate parameter values from Arrhenius and thus have Arrhenius parameters as global fit parameters
- Models are plugin-based and need to be programmed (currently no models are included directly)
- Improved Graph Layout Options and Scaling
- Added Graph Layout Settings dialog (right-click on any graph for access)
- Added dialog to set precise axis limits
- Graphs now support stepless scaling (scaling factor in Layout Settings dialog)
- Scaling is by default applied when exporting graph images, which allows exporting high resolution images with correct proportions
- Graph axes and legend now support advanced formatting
- Bold/Italic/Underline/Strike-Through font, Sub- and Superscript, Symbols
- Apply formatting in the Graph Layout Dialog with Editor
- You can now draw annotation objects on the graphs (arrow with or without textbox, text supports advanced formatting)
- Objects only show mouse-handlers if mouse is near the object
- Bug Fixes
- Fixed loading projects by double-click from Windows Explorer
- Fixed default plot preset for new installations
- Fixed a problem, that caused the Trial Client to shut down even if other RelaxIS instances were still open
- Disabled Import of .PAR files due to non-reproducible, yet required data filtering step. Please use Versastudio .Z Export instead.
- Fixed some possible program crashes
Version 3.0.4
- Codemeter License Improvements
- RelaxIS should no longer freeze when the Wibu license is no longer accessible (e.g. broken network connection, Windows stand-by...)
- Instead a warning message should allow return to working condition, once the license is accessible again
- ONLINE USERS: Please allow for a delay up to a minute until the License Dialog is shown (time-out delays of connection)! RelaxIS will be frozen during this time.
- After reconnecting the dongle, please wait for it to initialize (few seconds) before clicking Retry
- New Auto Save function
- In steady intervals the currently loaded project folder is automatically saved
- Either in user folder, or alongside original files
- This will not overwrite original file
- New Temperature dependent fitting models in Result Evaluation
- Linearized Arrhenius, logarithmic VFT
- Uses new pre-transformation feature in Result Evaluation Model plugins
- Linearization is performed automatically, you still just plot e.g. sigma vs. T in Result Preview
- More thorough fit algorithm settings
- Settings dialog allows selection of "Automatic Settings: Thorough"
- Slower than previous Automatic Settings, but better convergence properties
- Previous (Quick) mode still available (and used by default)
- Customizable Fitting Procedures
- Settings dialog allows creation of custom fitting procedure
- Set up multiple consecutive fit algorithm steps
- Allows creation of procedure similar to automatic settings
- Replaces previous Levenberg-Marquardt and Nelder-Mead settings
- Fixed the "Refine n-times" function
- Spectrum Views:
- Views can now save default settings
- When e.g. Residual View settings are saved, new residual view windows use these settings
- Added Export function to the Residual View
- Fixed crashes when a spectrum containes no (active) data
- DRT:
- Peak Picking now uses a specific minimum peak height setting instead of "x times median"
- Fixed possible crash when too many peaks were picked
- New integration areas are now created in the middle of the chart x-axis instead of the middle of the dataset
- Electrochemical Calculator:
- Some settings, like units are now saved
- Added option to keep the calculator window topmost
- Added option regarding exported frequencies to the Spectrum Exporter
- Improved the Changelog display in the Update dialog
- Some common popup tips can now be disabled in the Settings dialog
- Various bug fixes
Version 3.0.3.7
- Fixed a bug that prevented the "Hide Columns" button from working
- Added some clarification to the Batch Progress dialog
- Fixed possible crashes when files with too long paths were used
- Fixed possible crash related to plotting spectra
Version 3.0.3.6
- New Feature: Spectrum Views
- Under Plotting⮕Add Spectrum View additional plots and information windows can be displayed
- Additional plots (e.g. Bode/Nyquist), Fit Information, and residual plots can be shown (replaces prev. residual analysis feature)
- The windows can be docked, and persist after RelaxIS restarts
- Previously selected plot preset and transfer function now persist after a RelaxIS restart
- RelaxIS executables are now digitally signed to improve the installation process
- Added features to enable handling of dielectric data, which can be given in the permittivity without a cell constant
- The Export Center now allows selection of a number format
- Improved handling of parameter limits in the Auto Fit and slightly improved the default settings of the Circuit Screener
- The size of the circuit display in the Parameter Explorer window can now be adjusted
- Reworked the "Change Frequency Range" dialog to lessen confusion
- Several bugfixes
Version 3.0.3.5
- Fixed a problem that prevented the 3.0.3.4 update to install correctly on some systems
- Fixed and improved the IviumStat file format
- Improved file type detection
- Now reads Data Options: Temperature, NominalCharge (⮕Free Variable)
- If file contains multiple spectra, the start time relative to the first spectrum [s] is assigned to "Time"
- Improved Autofit value ranges for some parameters
- The Autofit "Advanced search" now automatically adjusts the ranges for fixed parameters
Version 3.0.3.4
- New Feature: DRT (Distribution of Relaxation Times)
- Calculate the DRT for multiple spectra/basis functions
- Peak picking and Integration
- Data Interpolation for higher resolution
- Added "Zarc" circuit element
- A parallel combination (R)(P), expressed in terms of Resistance and time constant
- Gives better access to real capacitance as C = tau/R
- Result Preview can directly plot average Real/Imaginary Parts
- Intended to facilitate single-frequency measurements
- New Descriptive Statistics model in the Result Evaluation
- Result Evaluation now shows relative fit errors
- Set Axis Texts dialog for the Result Preview graph now can access a list of special characters (e.g. greek letters)
- Added buttons to move selected spectra in the Explorer up and down
- Hold shift to move spectra to end of list
- Improved some details of the Auto Fit, mainly automatic ranges
- New buttons in the Residual Analysis window allow switching the active spectrum
- Improved chart borders to avoid axis titles to be placed outside of the chart
SDK Changes
- FileFormat plugins can access a SourcePath property, that contains the source file path, if the data source is a file
- Referenced assemblies for plugins can now be placed in a "References" subfolder of the Appdata\Plugins folder in order to be resolved correctly
Version 3.0.3.3
- Added IviumStat file format
- Added support for Drag&Drop from Outlook attachments
- Graph objects (circles, lines) now show further information
- The displayed weighted SSR in the Fit Information dialog used incorrect weights which could result in a wrong value.
Version 3.0.3.2
- New feature: Parameter Influence Test
- For the current parameter values of the active spectrum and the current transfer function, parameter influence is calculated as function of frequency
- "Influence" defines, how much the circuit immitance value is changed at the given frequency, when the parameter value is changed by a small amount
- Shows, in which frequency range certain parameters influence the spectrum
- Spectrum Aggregation improvement
- Renamed to "Combined Data Plot"
- Now allows recalculation of plotted values
- Either by formula
- Default transfer functions now implement normalization to Area and Thickness. This allows direct calculation and plotting of e.g. the permittivity instead of complex capacitance (see also: Changes to the SDK)
- Legend format now support the tag #G to display the spectrums group in the legend
- Added VersaStudio file format support
- Added "Change Metadata: Values from List"
- Slightly improved Conductivity Wizard's handling of bulk semicircles
- Fixed possible crash during RelaxIS startup
- Fixed pasting of metadata from Clipboard
- Fixed a possible crash of the FitWizard
- Fixed bug that could prevent use of the Browse for references button in the SDK Code Editor
- Further bug fixes
- SDK Changes (old plugins should still work, but may need to be recompiled!):
- DataManipulation plugins can now override Property DoesChangeData to indicate, that they do not change the underlying data (thus not invalidating any fits)
- TransferFunction plugins can now override Properties: CanBeNormalized, NormalizedSymbol, NormalizedUnit and Function NormalizeValue to return the geometry normalized value, e.g. permittivity from complex capacitance. This is used in the improved Spectrum Aggregation (Combined Data Plot) feature
Version 3.0.3.1
- New feature: Fit Curve extrapolation:
- The fitted curve is displayed over a larger frequency range, adjustable in the Settings dialog
- Settings in the Export Dialog can now be saved
- New metadata field: Concentration
- Improved integration of the Trial Client
- Trial Client now includes some automated tests
- Various bug fixes
Version 3.0.2.15
- Fixed a problem with switching transfer functions
- Improved RelaxIS startup speed
- Minor bug fixes
Version 3.0.2.14
- Fixed a problem that could cause the frequency selection in the Circuit Simulator to be invisible
- Plugins are now also loaded directly from the .XML files created by the SDK Code Editor
- Several minor fixes and improvements to the UI
- Backend changes
Version 3.0.2.13
- Fix of the Trial Installation procedure during the RelaxIS installation
Version 3.0.2.12
- Fixed bugs loading Nova2 NOX files
- Batch fitting now can ignore fixed parameters
- Added setting to only spread fixed/non-fixed parameter values and limits
- Fixed a problem when thinning out data in the Kramers Kronig test
- Added the Sciospec .Spec file format
- Better integrated the Trial Client into RelaxIS and the installation process. Manual edit of the server search list is no longer required.
- Further minor fixes and additions
Version 3.0.2.11
Updated the Codemeter Runtime to version 6.30d
- The Trial Client is installed with RelaxIS and can be started from the splash screen
- Drawn lines in the Data Explorer now show their angle
- The Result Preview Pivot now shows additional statistics for each series
- Fixes for several file formats (Nova NOX, Biologic, hcDLL)
- Better exception handling in several plugin types
- Fixed a possible crash when resetting window positions
- Plot and Circuit Image tags in Report templates will save images as files instead of embedding them, when called as e.g. NYQUISTPLOTSI (note the SI)
- The Battery Wizard now handles exclusively inductive spectra better
Version 3.0.2.10
- Added new weighting mode: By Magnitude
- Added new axis value: Tan(delta)
- Added more calculation options for unknown data files
- Added new version of the Electrochemical Calculator
- Newer PEIS biologic files can be read
- Added weighting by proportional/value to the Result Evaluation
- Improved autofit initialization when spectra contain negative Z' values
- The main ribbon now shows tooltips for all functions
- Various fixes of bugs and crashes
Version 3.0.2.9
- Fixed a crash in the Genetic Algorithm, e.g. when using the Circuit Screening Tool with unassigned spectra
- Fixed a possible problem that caused Codemeter to not recognize the license
Version 3.0.2.8
- Added a new Wizard to create code for Circuit Element plugins to the SDK Code Editor. The Wizard is similar to the Circuit Element Creator in RelaxIS 2.
- Added a new tool to apply parameter values to spectra from a simple list of values.
- The Autofit now takes fixed parameters and manually set parameter limits into account.
- The Aggregate Spectra tool now has a longer color list to distinguish between more spectra at the same time.
- Fixed some possible program crashes.
- Fixed some minor bugs.
Version 3.0.2.7
- Fixed a bug that caused the Result Evaluation feature to become unusable for consecutive fits
Version 3.0.2.6
- New Feature: Result Preview Pivot Table. It collimates statistics like minima and maxima from the different series that are currently plotted
- Added a plugin that allows reordering of parameter values from (R)(C), (RC), or (Hv) type subcircuits by time constant. Helpful after a multi-Autofit was performed on a chain with multiple of these subcircuits.
- Fixed a problem with importing NOX 2.0 spectra
- Groups in the Result Preview are now ordered the same as in the Spectra Explorer
- Ticking the checkmark on a group-node in the Result Preview Y-Selection now activates the first parameter in the group. Unticking it deactivates all parameters of that group.
- When importing text files it is now possible to import columns containing "Z'+Z''i" entries, e.g. 3.2+5.2i
- A lot of bug fixes and quality of life improvements
Version 3.0.2.5
- Initial parameters in the Result Evaluation dialog can now be spread to other fitting groups by using a right-click context menu
- The Result Evaluation now calculates and shows R²-values
- Fixed some bugs and possible program crashes
Version 3.0.2.4
- Fixed a crash related to sorting spectra
- Fixed a crash when exporting circuit images
- RelaxIS no longer switches to the foreground when a tooltip pops up
Version 3.0.2.0 - 3.0.2.3
PLEASE INSTALL THE CODEMETER RUNTIME, AS IT WAS UPDATED TO A NEW VERSION!
- New Feature: Auto-Fit
- Automatic one-button fit of a spectrum to a selected model
- No initial parameters required
- Quick & Thorough Mode, the latter is more reliable in the automatic initialization
- Can also be performed for multiple spectra at a time
- Hotkeys: F5 + F6
- Revamped the advanced Batch Fit
- Simplified the interface to avoid confusion with the selection of spectra and the order of their processing
- The old Batch Interface is still available under "Legacy Batch Fit"
- Added ability to add user-defined Hotkeys through the Setup Dialog
- New Feature: Duplicate Search
- Allows searching the current project for duplicate spectra based on selectable identifiers like same data, or same metadata
- Duplicates can be selectively removed after the search
- Spectrum Metadata can now be edited directly in the Spectra Explorer
- Hidden columns can be temporarily shown by clicking on the "7 columns hidden" field in the Spectra Explorer, to enter previously unused metadata
- The Result Evaluation feature can now be instructed to only fit the data that is currently visible in the Result Preview graph (e.g. when zoomed in) to allow quick data selection
- The Circuit Screening tool now allows selection of active circuits by group
- Improved performance of the Circuit Screening tool
- Parameter Errors are not shown anymore, when the fit is not up to date, to avoid confusion about when they are valid. The old behaviour can still be activated in the Setup Dialog
- You can now zoom individual axes of graphs by using the mouse-wheel while on top of the axis (does not work when scaled proportionally, e.g. in a Nyquist plot)
- Improved the export of circuit images to allow adjustment of the scaling for improved resolution, and fixed some rendering problems
- You can now directly Drag&Drop whole EIS3 Project files into RelaxIS
- Added the calculation of the cell constant through standard measurement values to the Electrochemical Calculator
- Fixed crash issues reported by users
- Fixed various minor bugs
Version 3.0.1.12
- Unused columns are now hidden in the Spectra Explorer as soon as the column contains data, it is shown automatically
- Improved the "Change Metadata" dialog with more options, e.g. rounding and changing by formula
- Added a new wizard: The Semicircle Wizard
- The wizard can fit multiple semicircles in the impedance, admittance or capacitance plane, together with additional features like inductance and polarisation.
- Please note: This feature is still in Beta status.
- Improved responsiveness of the UI
- Added magnitude and phase angle to the Spectrum Exporter
- Added the ZPlot2 file format
- Added Restart RelaxIS" button to the Code Editor
- Reduced the size of bubble popups and added ability to close them immediately by clicking
- Added "Accept Circuit" button to the Circuit Screener
Version 3.0.1.11
Please install the Codemeter Runtime during the installation, as it was updated to a new version in this release.
- Equivalent circuits can now have custom titles
- Titles are appended to the circuit in curly brackets
- A new text field was added to the circuit builder for the title
- Allows using the same equivalent circuit multiple times in a project
- CAUTION: Projects that contain titled equivalent circuits cannot be opened in previous versions of RelaxIS!
- The text representations of the series in a graph can now be changed when saving the graph as an image
- CDF plots in the residual analysis, Kramers-Kronig-Test and Bootstrapping error calculation now contain results of a Shapiro-Wilk-Test for normal distribution of the data
- Fixed a bug in the calculation for the R² values in the CDF plots
- Added the ability to change frequency limits to the DataManipulation plugin (specifically to the ImpedanceSpectrum_Fitted class)
- Added missing metadata options to the Unknown File dialog
- Fixed a wrong default file extension in the License Manager
Version 3.0.1.10
Please note: Changes to the RelaxIS SDK may cause your plugins to not load properly. You may need to recompile and/or adjust the code to fix them.
- Added new DataManipulation plugin type to the SDK
- Allows freely adjusting any aspect of a spectrum's data
- Can be accessed through ribbon buttons
- Added free designation of axes values to the Circuit Simulator
- Fixed possible crash on start-up related to docked windows
- New Hotkeys: TAB, Ctrl+TAB to select the transfer function and the plot preset
- Duplicated the transfer function button in the Plotting tab of the main ribbon
- Added more Quick Access buttons to RelaxIS (top-left corner)
- Additional bug fixes and minor adjustments
Version 3.0.1.9
- Added Raw Data Export functionality to all graphs (accessible using the right-click menu in the graph)
- Added Exclude All/None button to the Export Center
- Added Quicksave/-load buttons to the Spectrum Selection dialog
- Fixed a bug that could cause new, unsaved project folders from becoming unsavable
- Diversified status messages in the legacy conversion dialog
- More concise display of fit parameters in the Parameter Explorer
- Numeric values are copied at full precision from grids
- Additional bugfixes and adjustments
Version 3.0.1.8
- Fixed a critical bug that could cause error values for fit parameters to be higher than expected
- Added new Result Evaluation models
- Fixed a bug that may have prevented new plugins from compilation in the Code Editor
- The Zahner import now supports Multi-Sine spectra
Version 3.0.1.7
- The warning dialog of the Eraser tool can now be disabled for 60s after the use
- Spectra can now always be copied or moved to the Unassigned group, using the dropdown menu in the ribbon
- The DATASOURCE tag in reports now works again
- The Delete key now always works in the Raw Data Edit dialog
- Fixed a problem where some BioLogic files could not be imported
- Miscellaneous bug fixes
Version 3.0.1.6
- Minor bug fixes
- Some updates to the documentation
Version 3.0.1.5
- Added three new metadata variables: Time, Harmonic, Free Variable 2
- Removed individual metadata tags from reports, added new METADATA|Variable=xy tag
- Added checks to prevent problems with deleted/moved databases
- Added Log-Interface to plugins (AddLogMessage)
- Enhanced contents of the bug-reports
- A lot of minor and major bug fixes and quality-of-life changes
- Fixed some potentential crashes
Version 3.0.1.4
- Fixed a bug that prevented the Result Evaluation feature from working.
- Window parts (graph, settings) in Result Preview can now be resized
- Some High-DPI adjustments.
Version 3.0.1.3
- Fixed some problems related to database locks.
- Tutorials are now copied to your userfolder on program launch to avoid privilege issues
- Fixed a bug that caused RelaxIS to be minimized when windows were redocked to the interface
- Added a warning about plugins that failed to load
Version 3.0.1.2
- Implemented various Hotkeys. See the mapping here: https://www.rhd-instruments.de/relaxis/Hotkeys.png
- Implemented Datapoint Eraser tool to quickly delete single datapoints (as known from RelaxIS 2.x)
- Added two Tutorials that explain the basic functions of RelaxIS step-by-step.
- Drastically improved the support for High-DPI displays, including high-quality icons, and UI rescaling.
- RelaxIS now checks if databases are opened in another instance of RelaxIS and warns accordingly.
- By default the phase angle is now calculated for each transfer function individually instead of always for the impedance. You can access the impedance-phase angle by selecting another axis value manually.
- Added various clarifications in the UI
- A lot of quality of life fixes related to the UI
- Fixed a lot of bugs and crashes
Version 3.0.1.1
Important: If you have PLUGINS you need to update them in order to use them in 3.0.1.1 due to changes in the SDK. Refer to the manual and SDK documentation.
- New feature: Filesystem Watcher for RelaxIS Remote.
- This can watch a directory for new files and send them to a RelaxIS Remote Node
- Fixed bugs reported in the Bugtracker
- Improved Welcome Dialog to display recent project folders
- Added calculation of errors to the result page of the Result Evaluation dialog
- Revised the manual (typos etc.)
- Improved import speed of .EPS files when they contain harmonics! ;-)
- Fixed a bug where RelaxIS could fail to import contents of .NOX files
- Disabled the Baseline Correction feature temporarily due to unreliability
- Massively improved the icon quality
- Internal improvements
Version 3.0.1.0
- RelaxIS now contains a Manual for both the main program as well as the SDK
- IMPORTANT: Redefined the Warburg Short and Open formulas to exclude the tau parameter from the Zw parameter!
- See Settings⮕Plugins⮕User Elements for the new formulas. This will affect previously saved fits.
- Expanded the Fit Information dialog with more in-depth information
- New CDF Plots for normal distributions (residuals, Kramers-Kronig, ...)
- Result-Preview dialog now allows the automatic recalculation of errors when the Y-values are changed with a formula
- Improved the Genetic Algorithm
- Added a confirmation dialog when deleting spectra
- Redesigned the default report template with less grisly colors and embedded images
- Added Reset Window Positions button
- A lot of bug fixes and adjustments. You want to install this update.
- Added AC Voltage simulation features
Version 3.0.0.5
- Expanded RelaxIS Remote to accept connections without FTP server through a WCF interface
- Moved the CS3 Link interface to the SDK to allow third party usage
- Fixed bugs in some exporters
- Improved the Result Evaluation feature
- Added export functions
- Added the ability to fix parameter values
- Improved the Transmission-Line-Model:
- Greatly improved performance
- Addition of a Tlms element, resulting in a short termination instead of an open
- Added Bisquet-Open and -Short elements Bo and Bs, being special transmission-line modells used in DSSCs
- New experimental Baseline Correction tool
- Further Bug-fixes, etc.
Version 3.0.0.4
- Fixed a bug that caused files to being invisible in the file explorer
- Added an AC current and voltage display feature to the Circuit Simulator
- After files were inserted the last of those is activated in the file explorer
- Improved indentation in the SDK Code Editor
- Fixed multiple bugs and annoyances
Version 3.0.0.3
- New component: Circuit Simulator 3
- New component: RelaxIS SDK Code Editor
- Premade column designations are back
- Save prompts appear only for changed projects
- Improved performance for projects containing many files
- Increased font sizes for graphs
- Minor bug fixes
Version 3.0.0.2
- New function: Subtract Circuit
- New function: Edit raw data
- New function: Boss- & Panic-Buttons
- Changed Move & Copy functions to be more obvious.
- Added quickstart buttons to the Batchfit
- Added Help Buttons for formula inputs
- Rearranged the toolbar buttons
- Rearranged the Result Preview Window
- Fixed some crashes
Version 3.0.0.1
- Fixed a file permission bug, that prevented the Circuit Library from loading
- Added a Feedback form, accessible through the 'About' dialog
- Updated the CodeMeter software to the latest version
Version 3.0.0.0
This is the initial release of RelaxIS 3.
- A new and improved GUI
- RelaxIS Remote
- Genetic Algorithms
- RelaxIS SDK
- New project management system base on SQLite and much more.
⚠️ 2020/09/08 - Security Advisory
Wibu Systems informed us about new
security advisories for the Codemeter Runtime software.
Until version 3.0.15, the RelaxIS installer contained version
6.90. By advice of Wibu Systems we strongly recommend
downloading and installing the current CodeMeter User Runtime version
7.10a or later.
The current RelaxIS version 3.0.16 contains runtime version 7.20 and is not affected.
Please see
further user information here (PDF).


 Add to Request