RelaxIS 3.0.22 Feature Overview
We would like to give an overview over main new features in the upcoming RelaxIS 3.0.22 release.
In this article: Please click on the images in the gallery to see a scaled-up version.
In this article: Please click on the images in the gallery to see a scaled-up version.
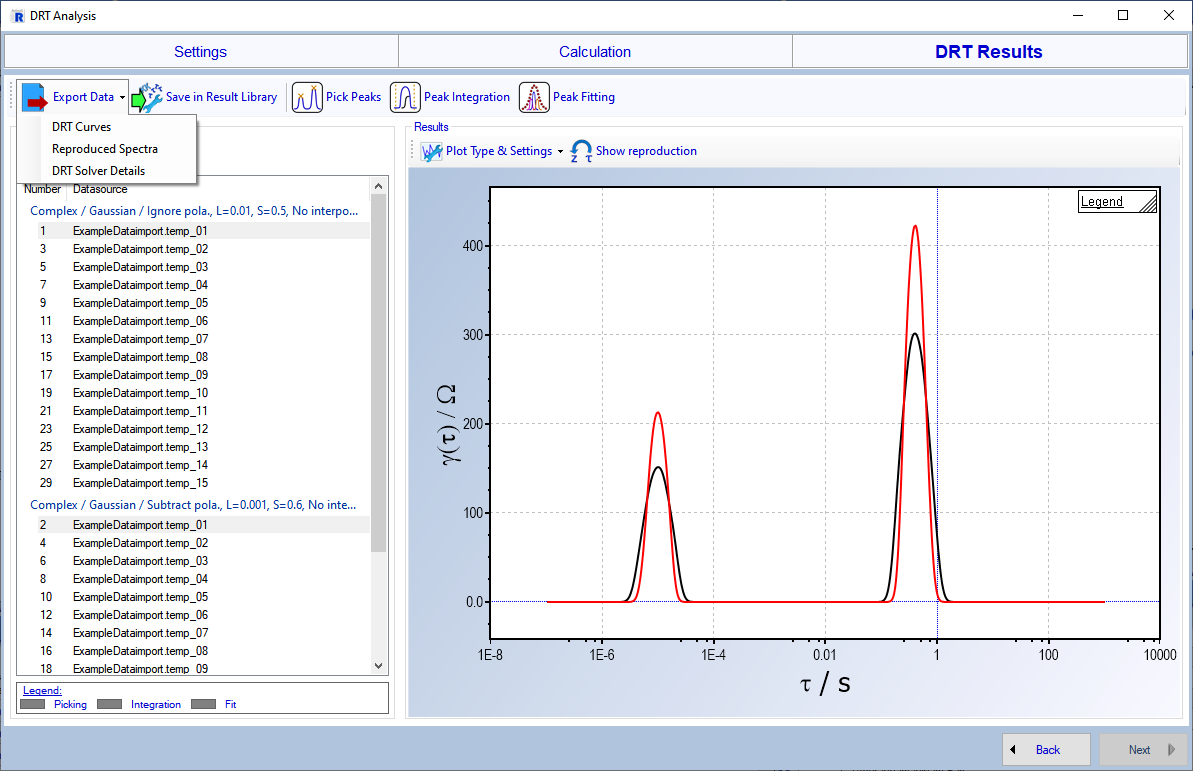
New DRT Dialog
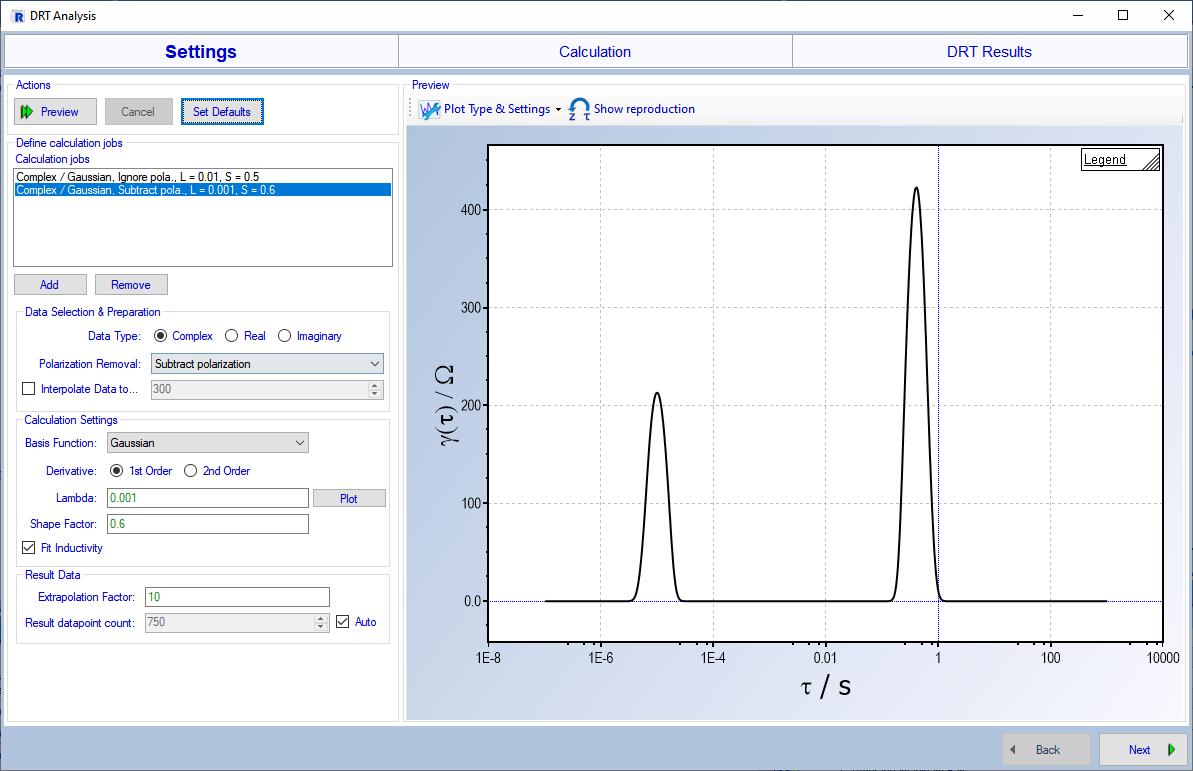
Greater flexibility for settings
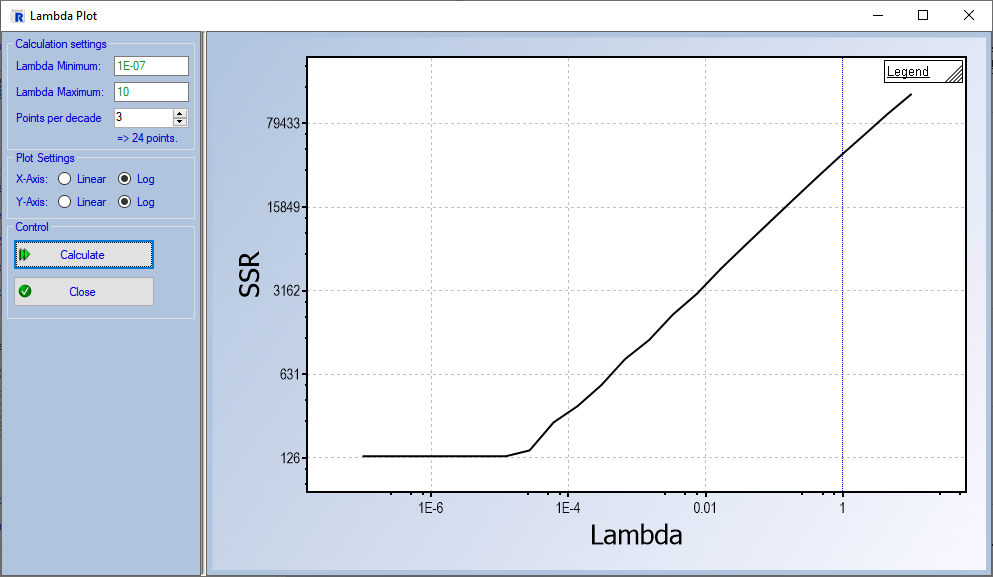
The DRT Dialog has been rebuilt from the ground-up with a more streamlined user-interface that at the same time gives better control over calculation, analysis and plotting tasks.
The Settings screen now gives you the option to define multiple complete sets of settings, called Jobs. Each job is calculated for each selected spectrum. This allows you to compare different settings with each other in a much more flexible way than before, when you were limited to calculating the DRT for multiple basis functions only.
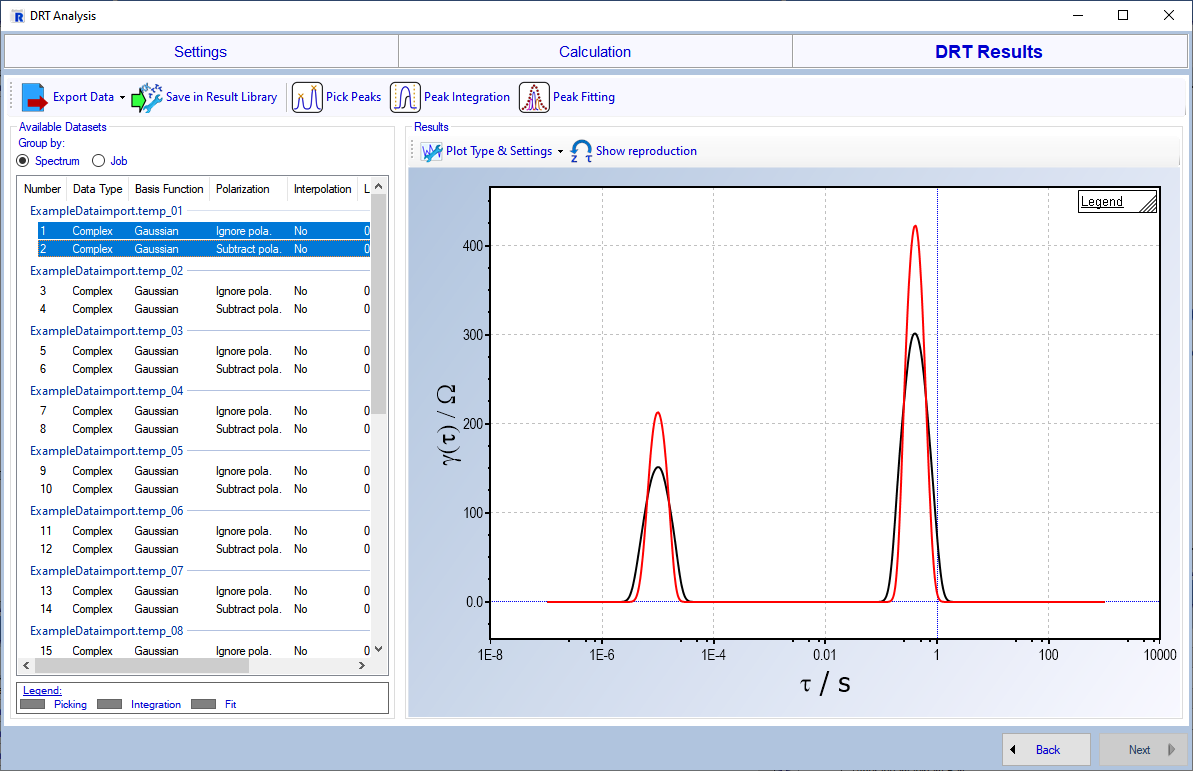
The result page features a new style of Result List that shows all calculated datasets and can be grouped by job or by spectrum. Selecting multiple datasets in the list automatically creates an overlay plot of the data.
DRT Dialog Gallery
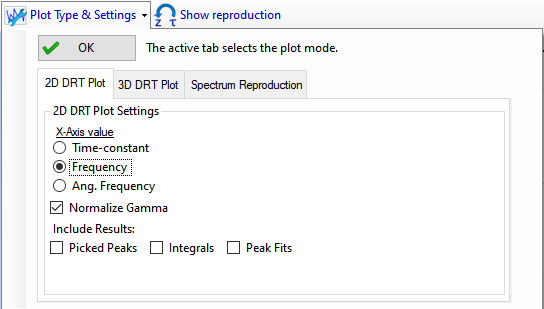
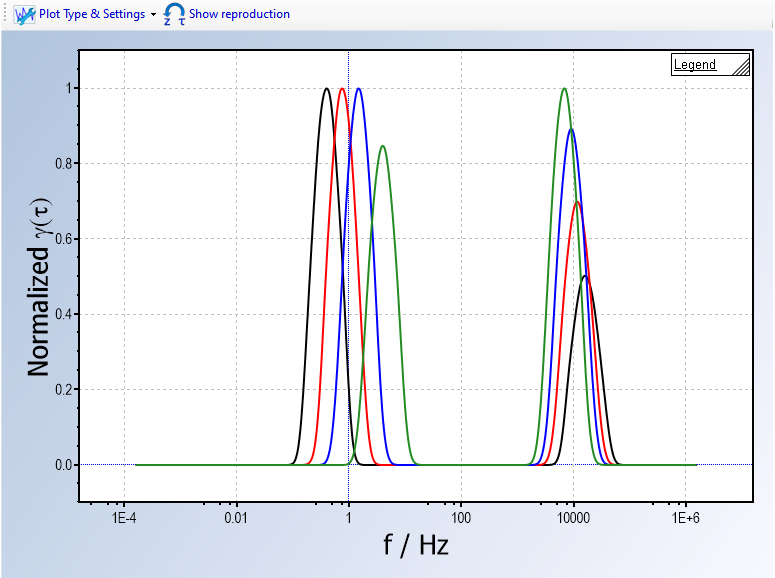
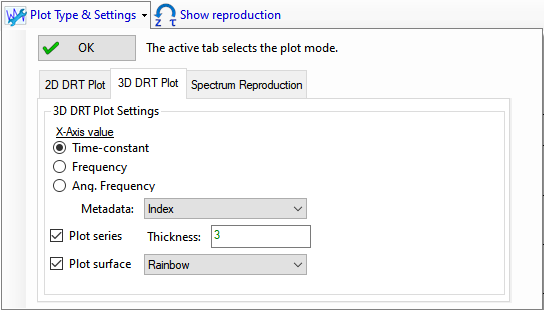
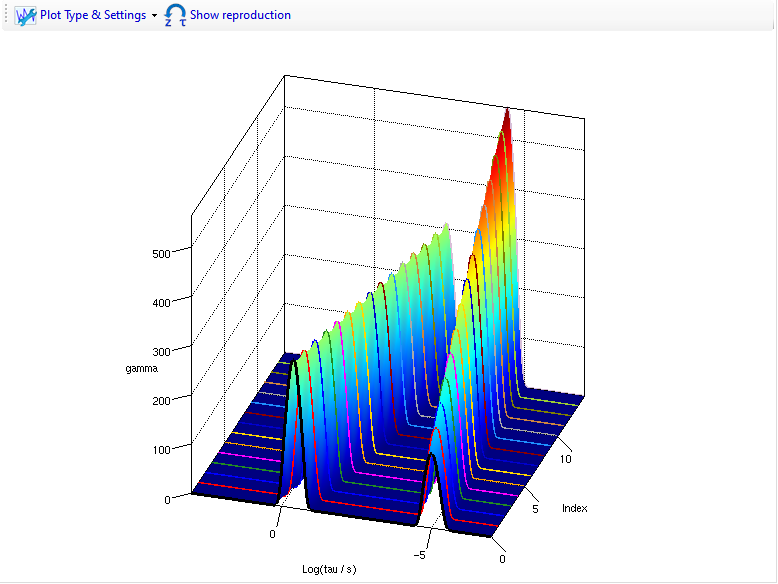
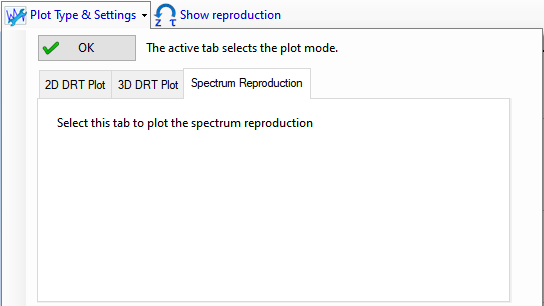
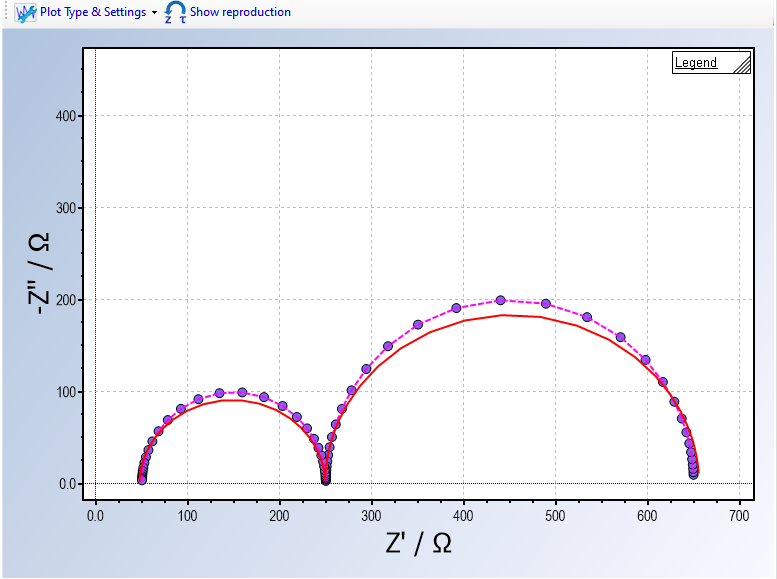
Improved DRT Plots
The DRT result plots have also gotten a major overhaul. Each plot can now seamlessly be switched between 2D, 3D or Spectrum Reproduction plots. The axes can be configured by selecting the desired X-value and the new ability to normalize the Y-axis.
3D Plot you say? Indeed: RelaxIS can now plot the calculated DRTs in a 3D overlay of the selected datasets. This plot can include a surface plot, giving a nice visualization of trends in the DRTs from e.g. spectrum to spectrum.
DRT Plot Gallery
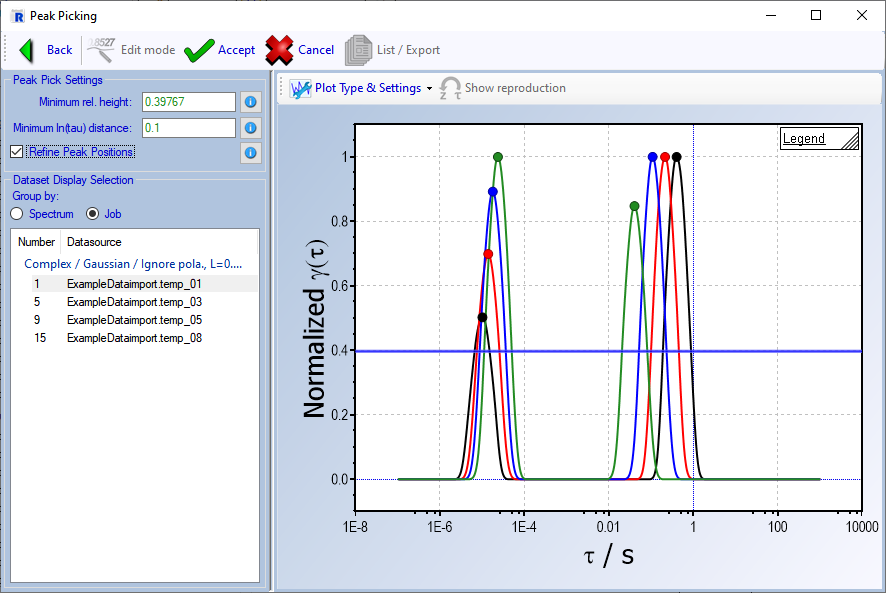
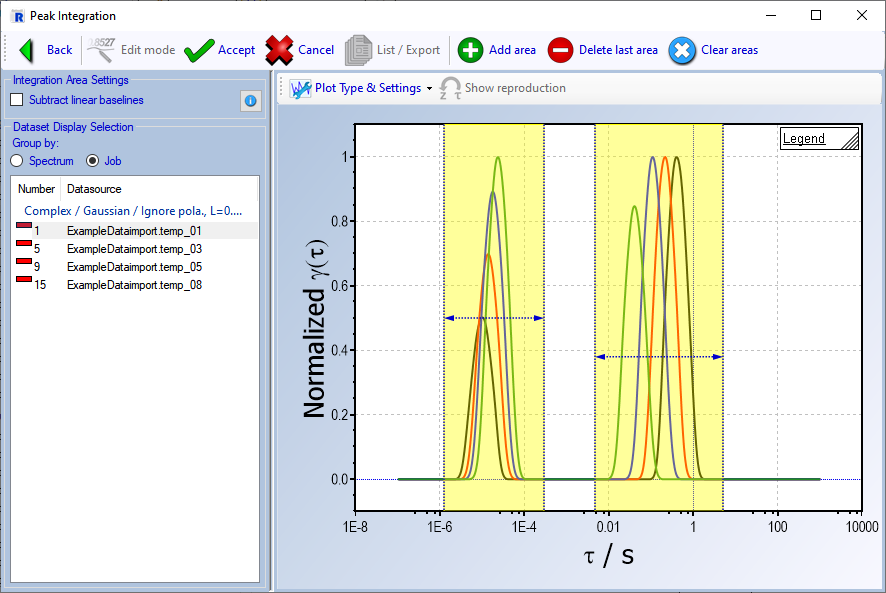
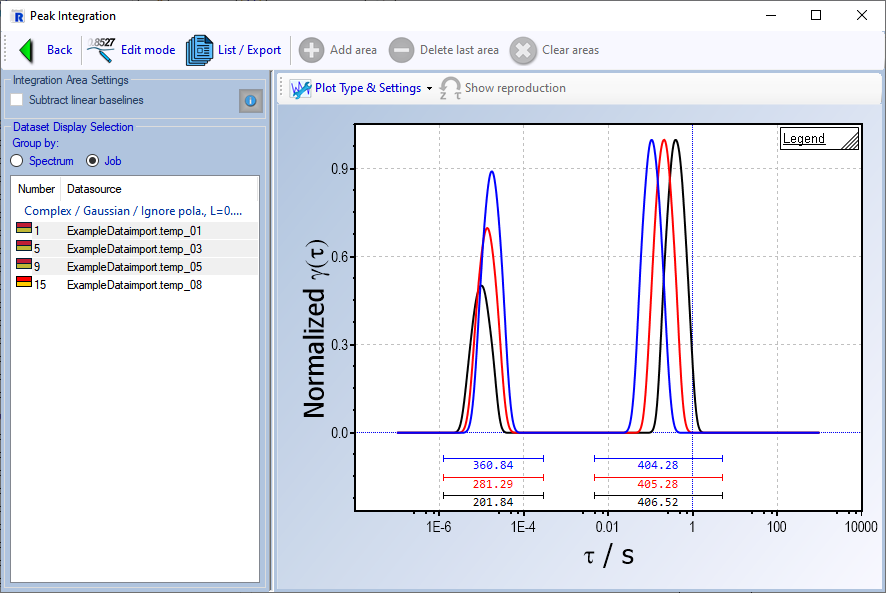
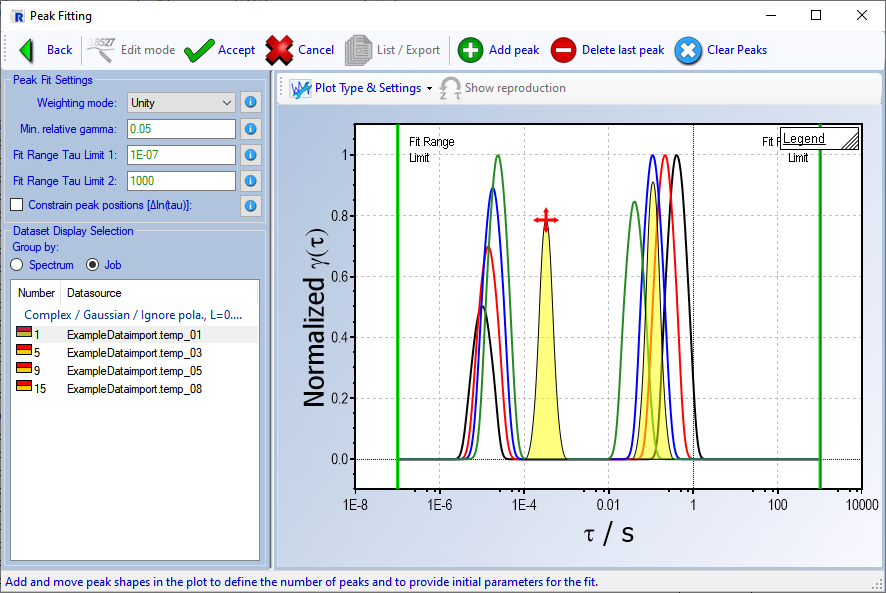
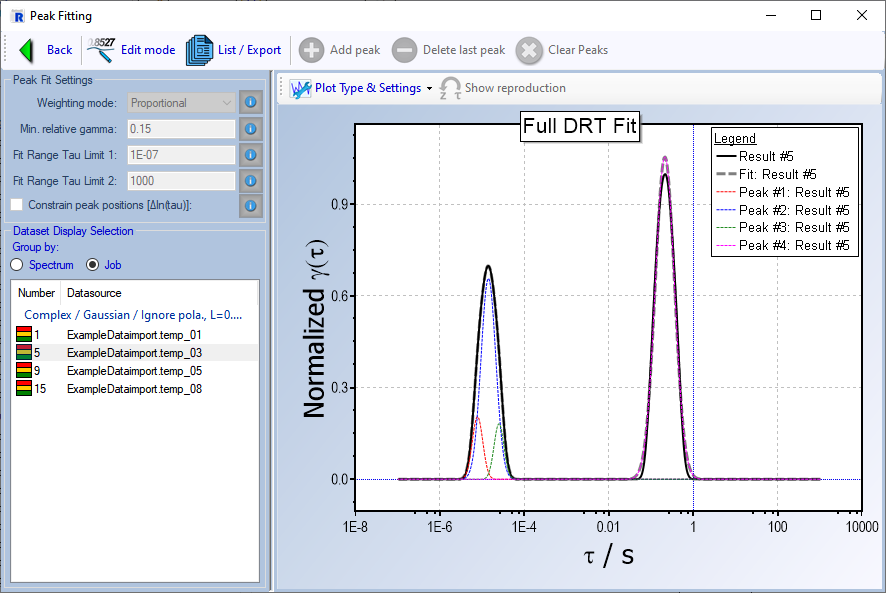
DRT Analysis overhaul
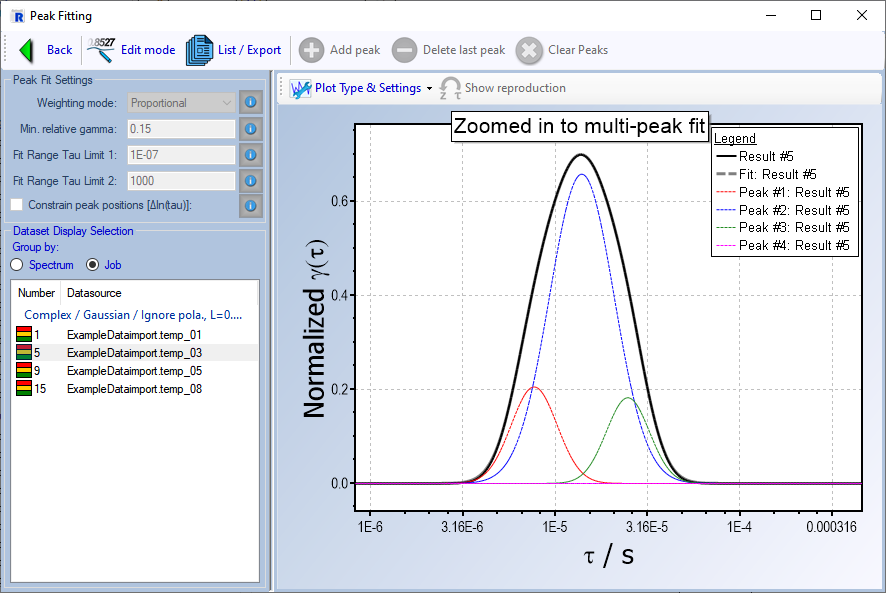
The DRT analysis workflow has now been streamlined between the previously available peak picking and peak integration functions and the new analysis function: Peak Fitting. The analysis tasks are now performed by first selecting the datasets to analyze, and then using a custom editor for setting up and running the analysis.
For example, the new Peak Fitting task is set up by placing the desired number of peaks to fit into the plot, adjusting limits and then executing the fit. Each dataset can have one of each of the available analysis types assigned, which is marked with a color next to the dataset in the result list (e.g. a green bar for peak fit).
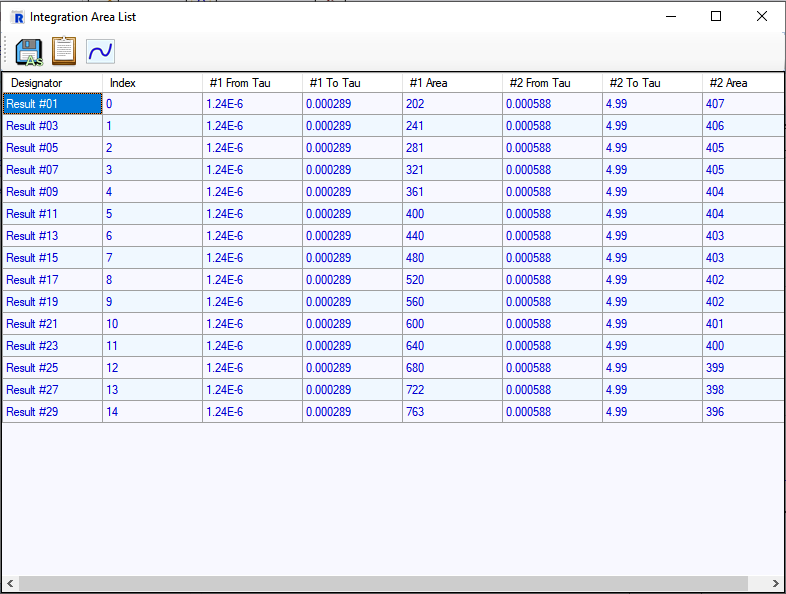
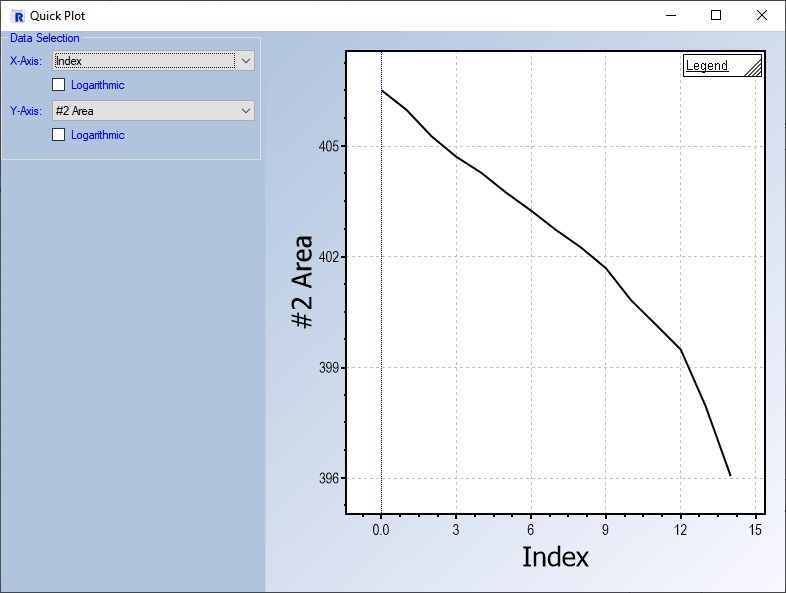
Each analysis editor also gives access to exporting or plotting the analysis results. This also includes a new Quick Result plot, that allows plotting of e.g. peak areas vs. metadata.
Analysis results can be visualized directly in the plot for a quick reference while browsing the results. The plot settings can configure which results are shown.
DRT Analysis Gallery
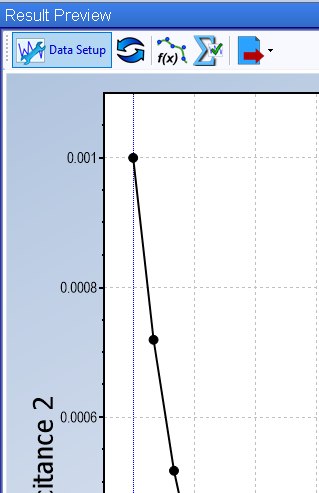
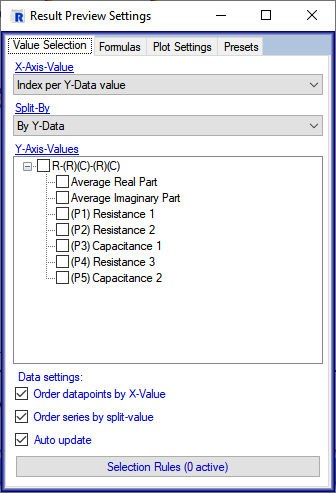
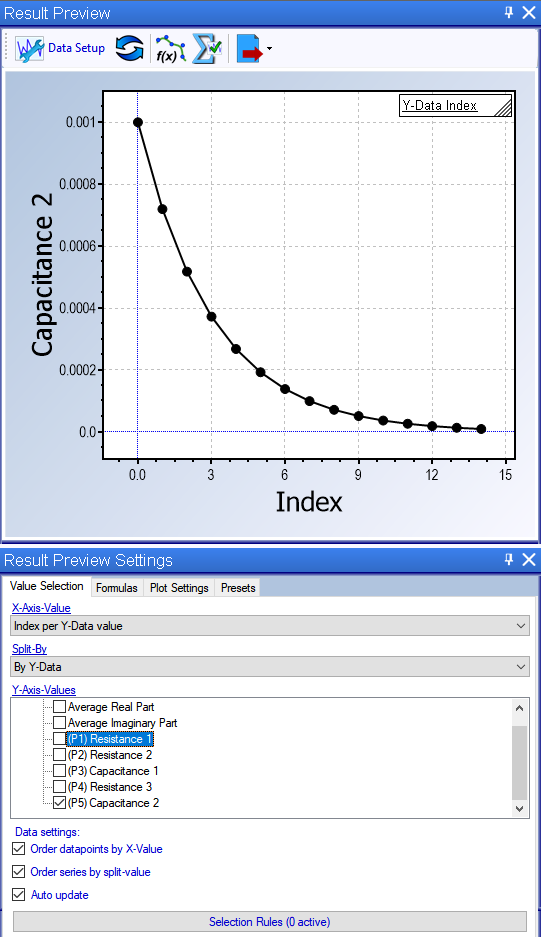
Result Preview Overhaul
The Result Preview is a powerful tool for examining the fit parameters of your results. Unfortunately, the design of the settings was unflexible and adding features to the result preview with the current layout was difficult. Therefore, the Result Preview was overhauled to facilitate adding new features to the interface and improving on the existing behavior.
All settings were moved to a separate settings dialog, that can be shown by clicking the Data Setup button in the new toolbar of the Result Preview dialog. To facilitate using a similar window layout as before, the settings dialog can be permanently docked to the main interface, e.g. at the bottom of the Result Preview.
While retaining all of the previous features, the new settings include additional options. For example the new default X-Axis (Index per Y-value) and Split-By (by Y-Data) modes facilitate a better default view of the data without initial setup. The plot now also assigns axis titles automatically.
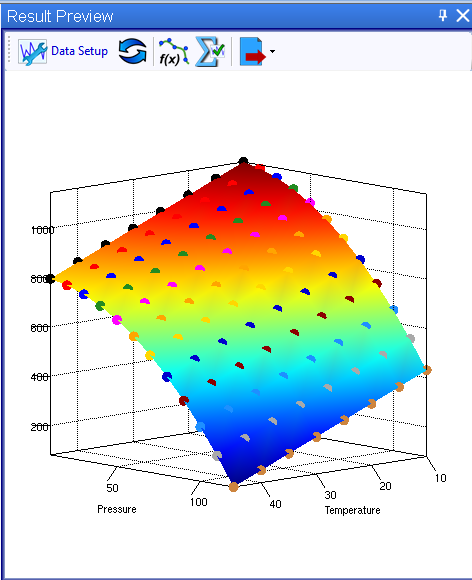
Further, when data is split into multiple groups, a numeric value is defined for each series depending on the split mode (e.g. an index, or a metadata value). This value can then be used for a formula calculation and also as a Z-value for the new Result Preview 3D Plot.
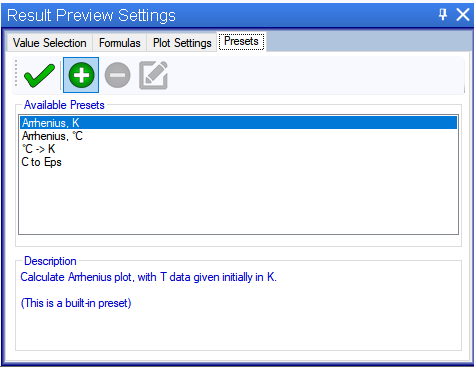
We further rolled the preset formulas from previous versions into a new Preset format, that includes not only the formulas but also the plot settings. That allows you to quickly recreate a previously used plot simply by selecting the correct data and a preset.
Result Preview Gallery
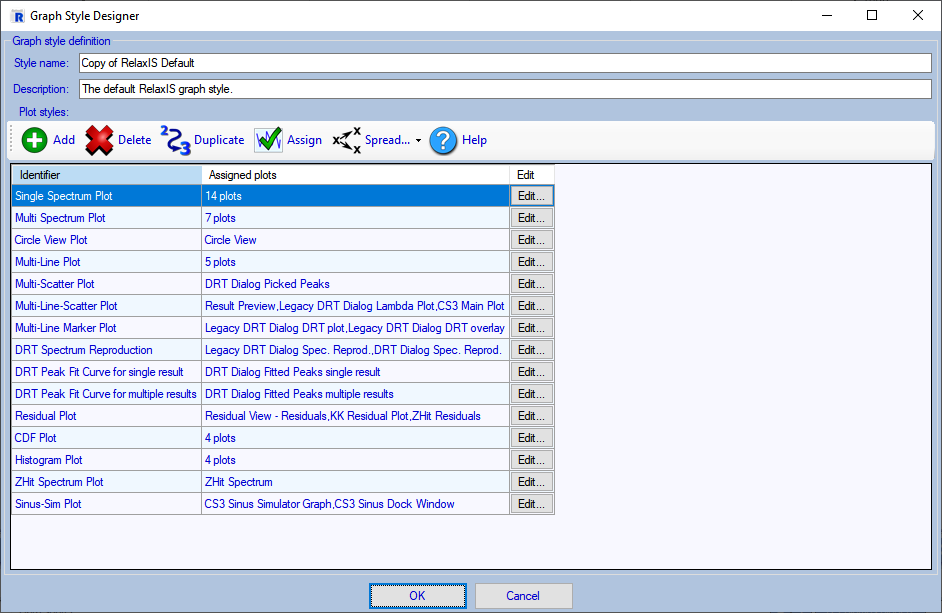
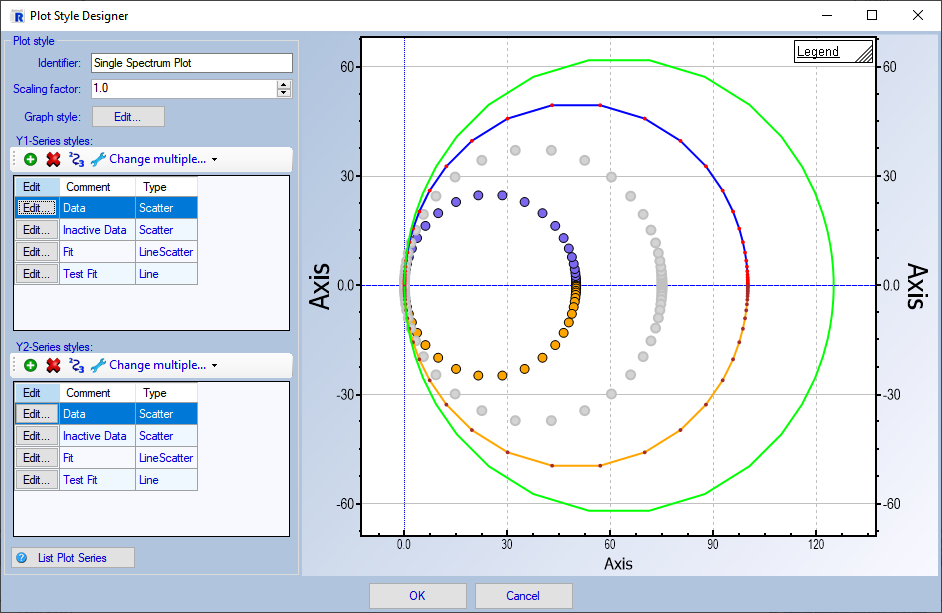
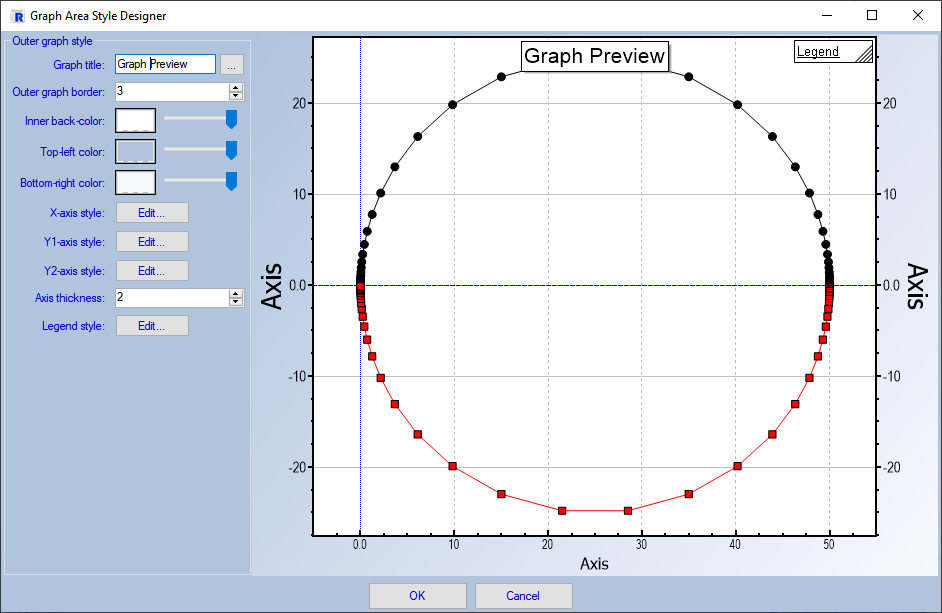
Improved Graph Style Definitions
RelaxIS contains many different graphs, from the Data Explorer, over the Result Preview to DRT and beyond. The graphs look is defined by a style that previously tried to roll the sometimes very different plots into a limited selection of styling options.
This system has been completely reworked. A graph style template now contains a variable number of plot style templates that determine the look of a particular graph and set of data series. For each specific plot in RelaxIS a specific plot style template is selected. That allows similar plots to use the same template, while still allowing full flexibility in styling individual plots. You can freely add plot style templates and assign plots to use it.
Further, the user interface for defining the templates has been rebuilt from the ground-up. Specific editors for each option are implemented, together with immediate previews, which should make designing the graph yourself much simpler.
Graph Layout Editor Gallery
Bugfixes
In addition to new features, the version also contains bug fixes and compatibility improvements, e.g.
- Compatibility adjustments for Biologic MPR files
- Various DPI related issues
- Bug that reduced the performance of the Nelder-Mead fit in some cases
- Improved support for CSV files by improved handling of quotation characters
- Improved the handling of Autofit parameter limits in certain edge cases
- Added some new example datasets for DRT and Mott-Schottky
- Added pressure metadata field
×
![]()